This is an example of 3D point cloud by Structure-from-Motion (SfM) Multi-View Stereo (MVS) photogrammetry. The 3D point cloud was produced from thousands of aerial photographs taken by small unmanned aerial vehicles (UAV), or unmanned aircraft or aerial system (UAS). The spectrum of colors indicates different information given to each point: red-green-blue (RGB) color, normalized differential vegetation index (NDVI) calculated using a near infrared camera data, topographic shade by eye-dome lighting (EDL), morphological roughness, and surface curvature. These data are readily obtained by SfM-MVS photogrammetry, and can be effectively used for various applications in geomorphology and related studies. For more details on SfM-MVS photogrammetry, see our review article in this issue (p. 321-343).
(Yuichi S. Hayakawa, Hiroyuki Obanawa, Hitoshi Saito, Shoichiro Uchiyama)
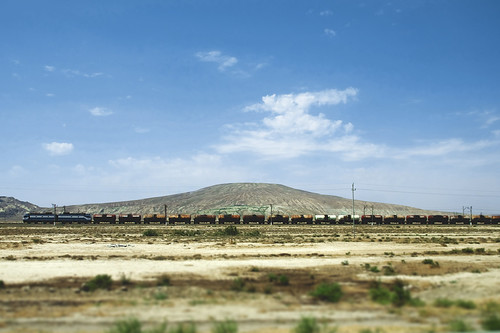
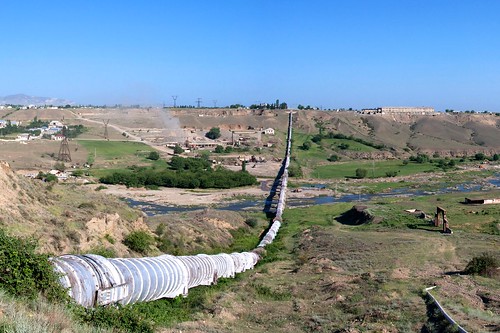
Numerous mud volcanoes are present in both offshore and onshore areas around Baku on the western coast of the Caspian Sea. Geomorphological studies have been carried out in the Dashgil Mud Volcano, located 50 km southwest of Baku, next to the Gobustan National Park that is a World Heritage with its cultural landscapes with prehistoric rock arts. The Dashgil has a 3-km diameter and 100-m summit elevation, and similar mud volcanoes are densely present in this region. "Dash (daş)" stands for rock or stone, while "gil" means clay. Normally, activities of these mud volcanoes are moderate with the continuous eruption of relatively cold materials including mud, water, and gas, but they can occasionally erupt massive gas to "explode" with flames hundreds of meters high.
カスピ海沿岸に位置するアゼルバイジャンの首都バクー周辺には、海底だけでなく陸上にも泥火山(でいかざん)が多数噴出している。地形学的な研究も行われているダシュギル泥火山は、バクーから南西に約50 km。近辺には、先史時代の岩絵などの文化的景観が世界遺産として登録されている、ゴブスタン国立保護区がある。ダシュギルは、直径3 km、標高100 m ほどの山であり、周辺にも同様の規模の泥火山が密に分布する。名称のダシュは石・岩、ギルは泥・粘土をあらわす。このような泥火山は、普段は穏やかに泥や水、ガスを噴出しているが、時折、何らかの要因で大量に放出されたガスが発火し、数百m もの高さの炎をともない「噴火」することがある。
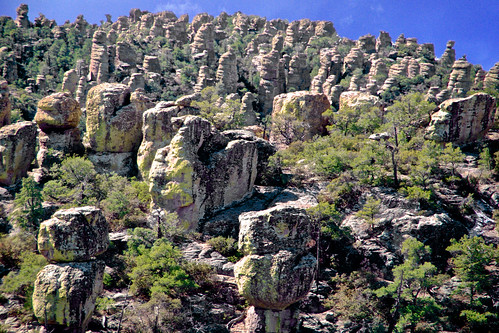
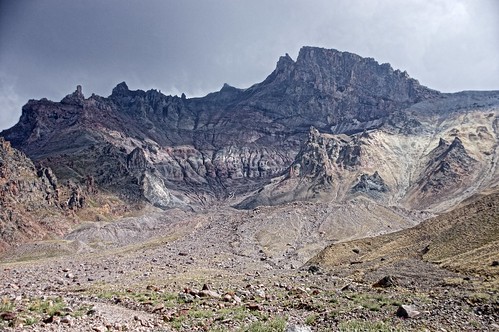
A large amount of rock monuments, composed of rhyolite welded ignimbrite by the Turkey Creek caldera eruption 27 million years ago, are present in this arid hilly land. Weathering and erosion along weak lineaments (joints) caused the formation of the tors, some of which are gravitationally displaced but keep superb balance before collapsing. Extensive wildfire (Horseshoe Two Fire) occurred in May-June 2011 to burn ca. 90,000 ha in this area.
If with the technique of SfM-MVS (Structure-from-Motion Multi-View Stereo) photogrammetry, one can contribute to visualize geographical information in specific areas with more details, in 3 dimensions.
Here is an example of the landslide occurred near the former Aso Bridge (which was destroyed away) in Minami-Aso region. Among else, this landslide was the largest and most distinct one related to the earthquakes.
Soon after the landslide was triggered by the midnight earthquake, many organizations began to obtain the aerial videos and images to be distributed online.
Although the resolution, sharpness and locational accuracy were not so high, this prompt result was good enough to help understanding the positional details of the landslide.
Then, using aerial images (oblique views) taken from a manned aircraft operated by GSI (Geospatial Authority of Japan), a 3D model and 2D map information were generated.
The images used are also shown at the top of this article.
Because the images had their positional information probably by camera-mounted GPS/GNSS receiver, the georeferencing of the 3D model was readily performed (however some errors may remain). The quality of the 3d model (resolution etc) was actually much better than that from the prompt newscast video.
The 3D model exported to a KML file enables to compare the conditions before and after the earthquake on Google Earth.
2D geographic information
Orthorectified photograph, hillshade image and topographic contours with 100-m grid.
Detailed morphological features can be recognized.
A zoom-up view (orthomosaic image and topographic contours):
Furthermore, using a video taken by an unmanned aerial vehicle (UAV, namely Drone) provided by GSI, more precise 3D model was generated.
Although the data is a video (not still images), the resolution of the images taken from the lower height is high enough to reconstruct the detailed features of the landslide. When we watch a video taken by a UAV, we may be able to recognize the detailed information of the objects in the video, but further information can be obtained if the images are projected onto a geographic space, i.e., the images are appropriately "mapped". Particularly, mapping of such information enables to find the changes of landscapes or landforms by comparing with existing map data. Here I put 6 GCPs (ground control points), whose geographical coordinates (XYZ) were obtained from an online map GSI Maps to refine georeference results. However some errors (several to tens of meters) may remain in the model - to correct this, it would be necessary to put more accurate coordinates of the GCPs.
Note that the area of coverage of images/videos by a UAV is limited due to some reasons (ability of flight, legal restrictions) compared to a manned aircraft. The UAV-derived model above actually lacks data in surrounding areas of the landslide.
Then the data by manned and unmanned aircrafts are merged to create a more complete model of the landslide and surroundings. A wide area can be covered by the images from high-altitude manned aircraft, while more detailed shape can be obtained by the pictures from low-altitude UAV. The 3D data is shown online as a point cloud. The point cloud was first generated using SfM software PhotoScan (Agisoft), and then it was tiled and optimized to be shown online by using "laspublish" function in LAStools (rapidlasso).
The WebGL system, "potree", also enables to perform some basic measurements of the point cloud, including calculation of distance, angle, area and volume, as well as extraction of swath profiles. Such functions are found in the left-side pane of the browser.
An example of longitudinal profile extraction
In addition, one can download the original point cloud data in LAZ format. Geographic projection is Japan Plane Rectangle CS II (JGD 2000 Datum). One may use free software such as LAStools (lasview function), CloudCompare and QuickTerrainReader (free version).
download by clicking "D"
Using such the three-dimensional data, further observation and analyses would become possible to obtain further insights into the landslide phenomena. For instance, one may think about the landslide damming of the river and following outburst flood, which could have caused further erosion and landslides on the valley-side slopes downstream, from differing points of view in the 3D data.
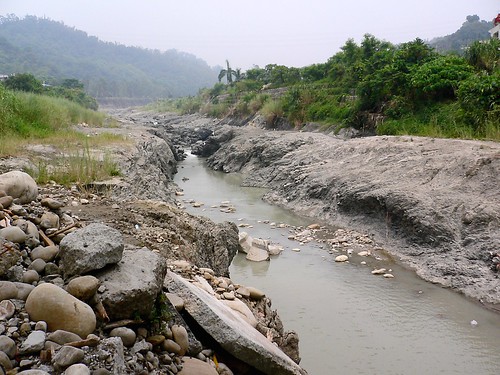
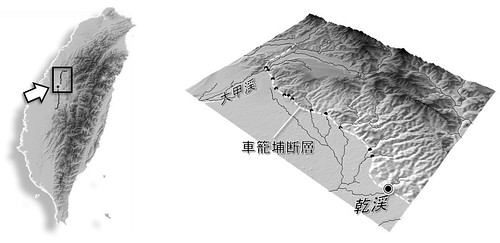
The Chi-Chi earthquake (M7.7), occurred on September 21, 1999, was associated with the activity of the Chelungpu Fault, along which surface ruptures continues for ca. 100 km with up to 10 m of vertical displacement. Waterfalls were formed in rivers flowing over the ruptures, and the most famous one having a height of 7 m was appeared in the Tachia River at the northernmost portion of the fault. The picture shows a fault-induced waterfall with 4-m height (at the center, slightly seen as white color) and a gorge of inner channel downstream of the waterfall in the Gan River in July 2005. This waterfall has receded for more than 200 m from the original location in 6 years after the earthquake, where rapid waterfall recession can be caused by abundant gravels transported from upstream areas with harder rocks, acting as abrasion material. We can also observe sidewall notches and downstream widening of the gorge, which suggest lateral erosion by the river following the waterfall recession. On the right side of the Gan River, facilities of formerly an elementary school, located just on the fault rupture and broken by the earthquake, are preserved and on exhibit as the Earthquake Museum.
(July 26, 2005, photo and text by Yuichi S. Hayakawa)
1999年9月21日,台湾中部でM7.7 の大地震が発生した。この際活動した車籠埔断層に沿って,地表には約100 km に渡る地震断層が生じ,その鉛直変位量は最大で10 m に及んだ。断層が河川を横切る地点は滝となり,とくに断層北部の大甲渓で高さ7 mの滝が形成されたことは多く報じられた。写真は,断層を跨ぐ河川の一つである乾渓において,2005年7月に撮影されたものである。細長く続く峡谷(inner channel)の奥に高さ約4 m の滝があり,この滝は地震発生から6年の間に元の断層の位置から200 m 以上も後退した。年間で数十メートルという後退速度は,岩盤侵食速度としては極端に大きい。これは,風化に対して脆弱な泥質の岩盤であることに加え,上流域から運搬されてくる硬質な砂礫が摩耗剤としてはたらき,侵食作用を促進させていることが一因であると考えられている。また,峡谷は下流ほど幅が広がり,その側壁にはノッチが形成されており,滝が後退したあとの側刻作用による谷の拡幅を示している。この乾渓右岸,断層の真上にあった学校は,その倒壊した建物や盛り上がった校庭が,地震教育園として保存・公開されている。
解説・写真:早川裕一
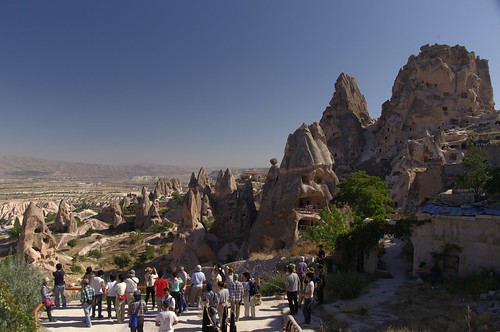
The rock mound on the right side is an inserberg named Uçhisar, in which many artificial caves are formed. Visited during the field trip of JGU-Ankara University joint meeting.
(September 16, 2010, photo by Yuichi S. Hayakawa)
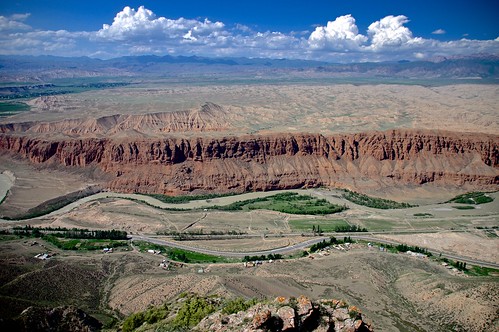
小コーカサス山脈から北流(写真左から右)するトヴス川は、本流であるクラ川に注ぐところで北向きの扇状地を形成する。その開析谷の比高は写真の地点で約60 m に及び、谷の内部には後氷期に形成された数段の段丘がみられる。現河床からは礫の採取も活発に行われ、対岸ではその工場からの煙が立ち上がっている。扇状地上を東西に流れる灌漑用水は、径2 m 超のパイプを通り、サイフォンとしてトヴスの深い谷を横断する。
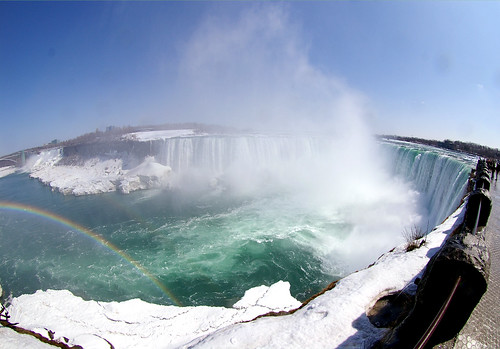
Niagara Falls was formed at the Niagara Escarpment, 11 km downstream the present location of the waterfall, on ca. 12,500 years ago when the Niagara River drained from upstream Lake Erie across the cliff. The mean recession rate is ca. 1 m/y, while the long-term recession rate has varied due to changes of water discharge of the Niagara River. Water intake for power plant since a century ago caused decrease of the water discharge flowing over the waterfall, and the waterfall erosion has been stagnated, with its present recession rate on the order of centimeters a year. The embowed horseshoe shape of the waterfall can also be another factor stabilizing the waterfall against erosion.
An erosion model on Niagara Falls has been proposed by G.K. Gilbert a century ago, suggesting the caprock structure of the waterfall face, in which erosion dominates on the lower shale layer (undercut by plunge-pool swirling flow). Although the model has long been regarded as representative one that explains waterfall erosion, such a caprock model cannot be applied for many other waterfalls that are buttressed, and severe erosion in the plunge pool is also doubtful because currents in the deep pool may not be so strong to cause entrainment of fallen brocks and bedrock erosion.
Photo and text by Yuichi S. Hayakawa
ナイアガラフォールズは約12,500 年前,ローレンタイド氷床の後退にともない,エリー湖からオンタリオ湖へ向けて北流したナイアガラ川が,東西に走るナイアガラ・エスカープメントを横切る地点で形成された。以降,継続的な侵食により滝は現在の位置まで約11 kmを後退した。平均して年間約1 m 弱の後退速度となるが,過去の後退速度は一定ではなく,たとえば約1万年前からの5000年間は,エリー湖より上流の氷河湖からの流出経路が異なったため,1 kmしか後退が進まなかったことが貝化石の14C 年代(未較正)から推定されている。また,20 世紀には水力発電のための取水が始まり,観光用に日中の流量は確保されているものの,滝を通過する総流量は激減した。同時に滝の侵食も遅くなり,現在の後退速度は年間数 cm 程度であると言われている。また,ホースシューフォールズ(写真手前)は300 年前にはより直線的な平面形状を呈していたが,これが徐々に馬蹄形となることで応力分散により安定し,侵食が遅くなる一因となっているという説もある。
20世紀初頭に提案されたG.K. Gilbert によるナイアガラフォールズの侵食モデルは,滝壺の渦流が滝面下部の頁岩の水平層を侵食し,キャップロックとなる上部のドロマイトが崩落する,というものであった。長い間これが滝の侵食の典型的なモデルとして広まっていたが,実際にはキャップロック構造をもたない滝は多く,滝一般においての事例としてはむしろ稀な方であろう。さらに滝壺底部に侵食をもたらすほどの渦流が生じるという説明は,ナイアガラフォールズにおいてさえ推測の域を出ておらず,滝の侵食プロセスに関して不明な点は未だに多い。
2014年5月2日に発生した北東アフガニスタンでの大規模斜面崩壊(地すべり)について、報道されている写真から3Dデータ化を試みた。
I tried to construct three-dimensional data from photographs taken by reporters.
使用したのは、以下のようなサイトでも公開されている、様々なソースの写真。最終的に5つの空中写真を利用した。
(はじめは先に公開されていた地上写真からも試みたが、視点が異なり過ぎてうまくマッチングしなかった。)
The photographs from various sources shown in the websites below were used for the 3D reconstruction. Five aerial photographs were successful to be used. boston.comThe Atlantic
PhotoScan(R) を使用し、基準点座標はGoogle Earth から参照しながら、SfM(モーションからの構造解析)による3Dモデルを作成。
Structure-from-Motion (SfM) was performed to create a 3D model from the photographs using PhotoScan(R) software. Coordinates of ground control points (GCP) were obtained by referring to the points in satellite images on Google Earth.
ただしモデル作成後の基準点座標には100 m 近いの誤差も含まれる(Total error = 53.8 m)。
The GCP errors are typically 53.8 m but some are nearly 100 m.
KML(KMZ)ファイルにエクスポートし、Google Earth 上で表示させると、崩壊発生前後の変化がよく読み取れる。
Exporting to KML (KMZ) file, the scenery before and after the landslide occurrence can be seen on Google Earth. [ source KML ]
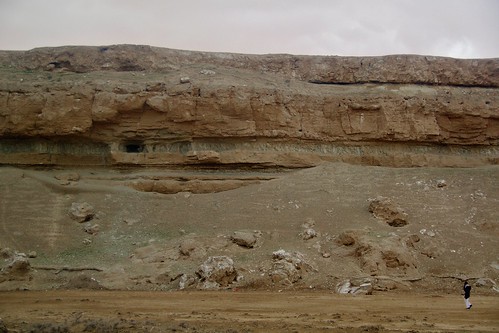
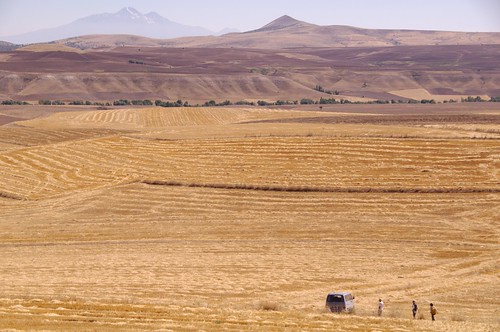
Low-relief erosional surfaces are widely present in central Anatolian highland, where mountains or hills surrounded by gentle slopes are covered with crop fields to their summits. Slopes on these "low-relief" surfaces are generally gentle and geomorphic processes therein seems relatively slow, but many active geomorphic features are actually found: for instance, current small rivers incises for several meters in depth into a wide Holocene floodplain (shown in the center of the photo, a river runs along the trees from left to right), and steep slopes beyond the river have thin soil layer and surface materials are actively transported during heavy rainfall and in snowmelt season. Although the overall form of the low-relief surfaces can be peneplain or a relict landform of ancient long-term erosion, present geomorphic process are not so inactive in the region.
Many active faults run through these low-relief surfaces surrounding the Anatolian highland. A pull-apart basin, divided by normal or slip faults (a part of the East Anatolian fault zone), is located beyond the hill ridge in the upper portion of the photo, where volcanic activities have occurred since several million years ago.
Mt. Erciyes (3,917 m), shown in the upper left of the photo, is the highest volcano in central Anatolia. The mountain provides a place of skiing in winter, and snow around the summit is observable year-round. A glacier is present just below the summit on the north-facing slope (photo), which have severely retreated and is shortly disappearing. The photo shows an amazing scenery which contrast strong sunlight in the close view and cold ice in the distant view.
(Photograph and text by Yuichi S. Hayakawa, Aug. 2009)
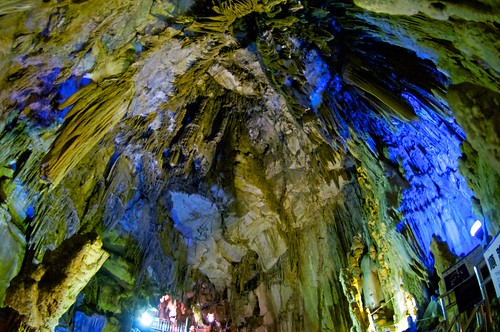
あぶくま洞(福島県田村市)は、結晶質石灰岩の岩体に形成され、さまざまな形状をもつ鍾乳石が豊富に観察される。また、洞窟の壁面上部には未固結の礫層も残り、過去の洞内における流水作用も示唆される。洞窟の上位にあたる仙台平には石灰岩層と頁岩層との境界にドリーネが形成され、あぶくま洞への水の経路にもなっている。
(July 2012, photo by Yuichi S. Hayakawa)
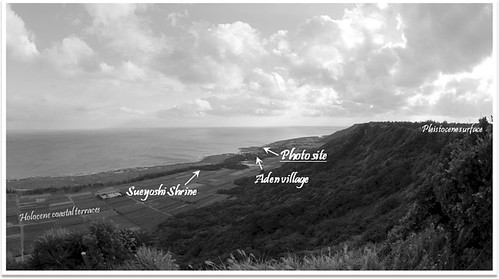
Kikai Island (Kikaijima) is famous for the
modern coral reef studies undersea. However, the ancient coral reef, which
currently composes coastal rocky landforms, is also another important topic for
geomorphologists.
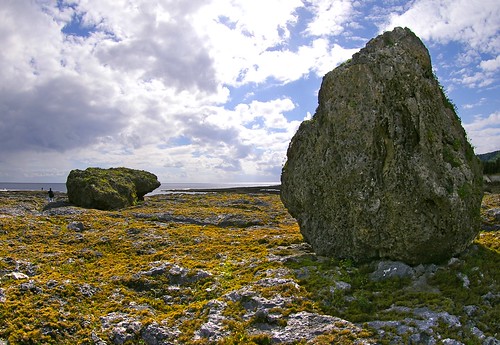
Numerous large limestone boulders, coming
either from ocean as tsunami deposits or from mountain-side cliffs as fallen
block, are distributed upon the coral-limestone surface of uplifted coastal
terraces in eastern Kikai Island. Being fixed on the uplifted surface, the
boulders act as "umbrella" to save the bedrock limestone beneath them
from dissolution by raindrop. The surface of the terraces broadly lowers due to
the rainfall-induced dissolution, and the protected portions beneath the
boulders remains as pedestal.
The boulders in the picture are located on
relatively young surface of uplifted coastal terrace, whose duration of
dissolution is approximately 1,500 years. Small pedestals with a height of
several tens of centimeters, as well as dissolution pits on the surrounding
terrace surface, are being formed . Higher pedestals, often exceeds 1 m at
6,000 years after emergence, are observed on higher terraces inland. The
pedestals therefore allow us to obtain the surface lowering rate of the
uplifted coastal terraces, which means the dissolution rate of the coral-reef limestone in Kikai Island. (See also the report by Hayakawa et al. in thisissue)